
An approaching sound source sends air compressions towards us at closer intervals. More arrive each second, so the tone sounds higher. When the source moves away, fewer arrive each second and the tone sounds lower. This is the Doppler effect.
The cover is an illustration. To explain the effect, imagine a siren emitting a steady pitch, still air and a listener who stays in place. The vehicle travels more slowly than sound.
Pitch follows a rhythm
Sound travels through air as pressure changes. Slightly more compressed regions alternate with less compressed regions.
The number of oscillations reaching an ear each second is called frequency. For a simple tone, more oscillations each second mean a higher pitch.
The source moves between emissions
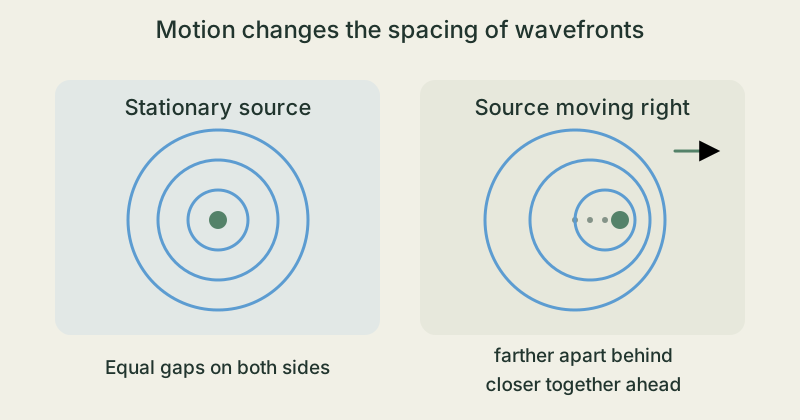
A stationary source with a steady rhythm produces evenly spaced wavefronts. Each new compression starts at the same place.
A moving source sends the next compression from a new place. Compressions are closer together ahead of it and farther apart behind it. Sound already emitted spreads out from the place where that part of the disturbance began.
A different rhythm reaches the ear
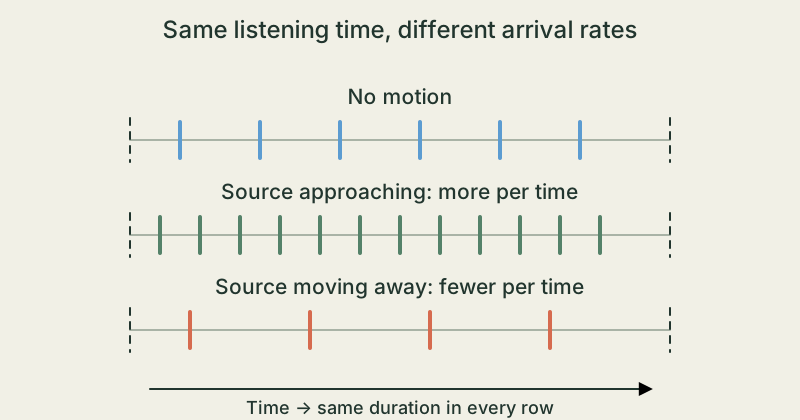
As the source approaches, more compressions reach the stationary listener each second. As it moves away, fewer arrive. The emitted tone does not have to change.
The vehicle does not simply make sound travel faster. Under the same air conditions, sound keeps the same propagation speed. What changes is the spacing between compressions, and therefore their arrival rate.
Higher pitch and greater loudness are different
A nearby vehicle may also sound louder. Loudness and pitch are different properties, though. Here, the Doppler effect explains the changed rhythm.
Real sirens often switch between pitches themselves. That happens in addition to motion. A siren's every rise and fall is therefore not proof of a Doppler effect. Our diagrams deliberately use a steady emitted tone.
Same time, different count: a paper model
- With an adult, draw three horizontal lines, each 20 cm long, one below another. In every row, the start and end represent the same chosen time interval, not a distance along a road. Label them “no motion”, “source approaching” and “source moving away”.
- In the first row, add short ticks at 2, 4, 6 and so on up to 18 cm. In the second, add a tick at every whole centimetre from 1 to 19. In the third, add ticks only at 3, 6, 9, 12, 15 and 18 cm. Make all ticks the same height. Count and record them: 9, 19 and 6. Which row shows more arrivals in the same time?
- Compare your rows with the second explanatory diagram. Closer ticks stand for a higher arrival rate. Their height does not represent loudness. This freely chosen paper model makes no sound and contains no measured frequencies or vehicle speeds. Also check the first wave diagram: on which side of the moving source are the gaps smaller?
Keep this activity at a table with paper, a ruler and a pencil. There is no need to play sirens, swing devices, follow vehicles or wait beside a road. This is not a hearing test; the drawings can be compared without listening.
The takeaway
For a steady emitted tone, motion changes the rhythm reaching the ear: approaching sounds higher, moving away sounds lower. This is the Doppler effect. A real siren can change its own pitch as well.
Why does an approaching source emitting a steady tone sound higher to a stationary listener?
Sources & further reading
OpenStax / Rice University · University Physics Volume 1: The Doppler Effect ↗NASA Glenn Research Center · Doppler Effect ↗NASA Space Math · Electromagnetic Math: Doppler Shifts and Sound Waves (PDF, S. 77 / PDF 172) ↗NOAA / National Weather Service · How Radar Works: Doppler Shift ↗Our stories explain the main idea in our own words. Pictures and models simplify reality and are not drawn to scale.